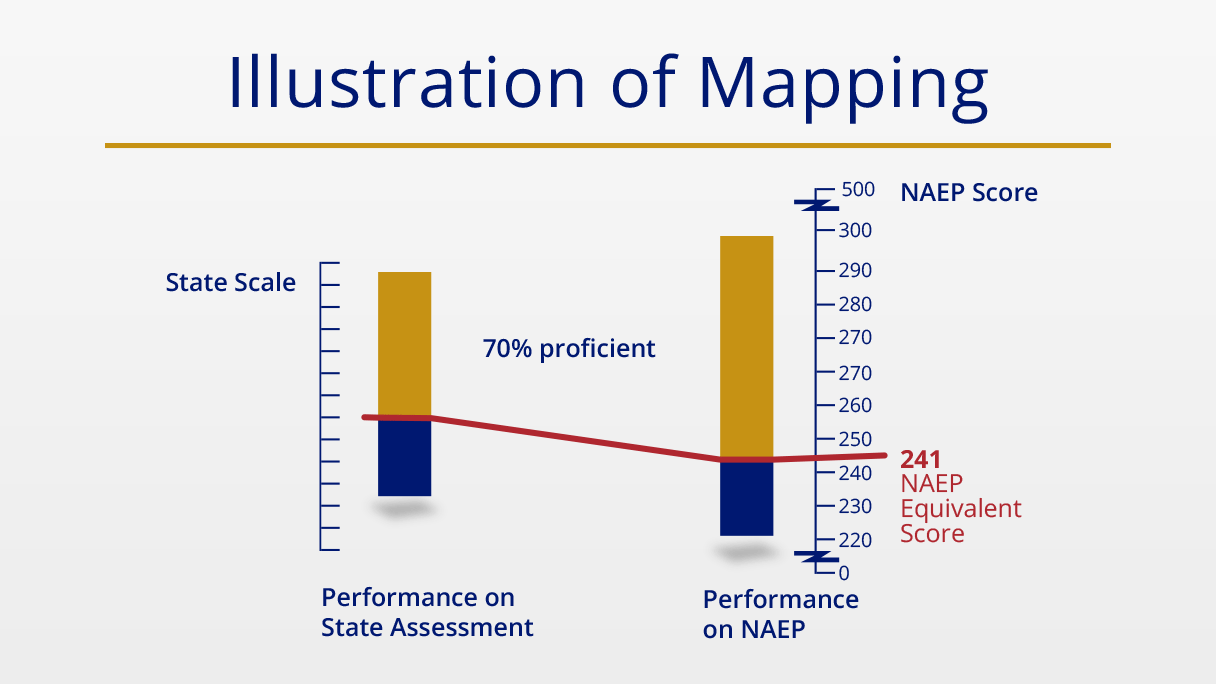
Since 2003, the National Center for Education Statistics (NCES) has compared each state's standard for proficient performance in reading and mathematics by placing the state standards onto a common scale of National Assessment of Educational Progress (NAEP). This process of "state mapping" shows where each state's standards falls on the NAEP scale and in relation to the NAEP achievement levels: Basic, Proficient, and Advanced, providing important contributions to the discussion of state standards.
The state mapping studies performed by the National Center for Education Statistics (NCES) offer several important contributions to national education analyses.
First, the mapping analyses allow each state to compare the stringency of its criteria for proficiency with that of other states. Second, they inform a state whether the rigor of its standards, as represented by the NAEP scale equivalent of the state’s standard, changed over time. Significant differences in NAEP scale equivalents might reflect changes in state assessments and standards or changes in policies or practices that occurred between the years. Finally, when key aspects of a state’s assessment or standards remain the same, these mapping analyses allow NAEP to corroborate state-reported changes in student achievement.
NCES has released six mapping reports using state data for reading and mathematics at grades 4 and 8 from 2003, 2005, 2007, 2009, 2011, 2013, and 2015. This sixth report highlights results of mapping state proficiency standards onto the NAEP scales using state assessment results for public schools from the 2014–15 school year and the 2015 NAEP assessments. The report focuses on the reading and mathematics standards that states set for grades 4 and 8 for federal reporting under the 2001 and 2015 reauthorizations of the Elementary and Secondary Education Act of 1965.
Key Findings
The 2015 study—the sixth in the series—analyzed the standards set for public school students for the 2014–2015 school year in reading and mathematics at grades 4 and 8. This report also analyzed the standards of proficient performance of the three major testing programs: ACT Aspire (ACT), The Partnership for Assessment of Readiness for College and Careers (PARCC), and Smarter Balanced Assessment Consortium (SBAC).- States are setting higher benchmarks for “proficient” performance.
- The difference between the states with the highest and lowest expectations is narrowing, due in large part to movement on the lower end of the scale.
2015
- Percentage of NAEP schools available for comparing state assessment results with NAEP results in grades 4 and percentage of the student population represented in these comparison schools, by subject and state: 2015
- Percentage of NAEP schools available for comparing state assessment results with NAEP results in grades 8 and percentage of the student population represented in these comparison schools, by subject and state: 2015
- Percentages of students meeting state proficiency standards and performing at or above the NAEP Proficient level, by grade, subject, and state: 2015
No comments:
Post a Comment